Description
Create Tile-Grid Geographical Maps.
Description
The 'tabularmap' is one of the visualization methods for efficiently displaying data consisting of multiple elements by tiling them. When dealing with geospatial, it corrects for differences in visibility between areas.
README.md
tabularmaps
tabularmapsは、CC0で公開されているカラム地図プロジェクトが進める行政区分等のグリッドレイアウトによる可視化をRパッケージとして提供するものです。
インストール
インストールはGitHubを経由して行います。まずremotesパッケージをCRANからインストールした後、remotes::install_github()で行ってください。
install.packages("remotes")
remotes::install_github("uribo/tabularmaps")
使い方
library(tabularmaps)
library(ggplot2)
日本国内
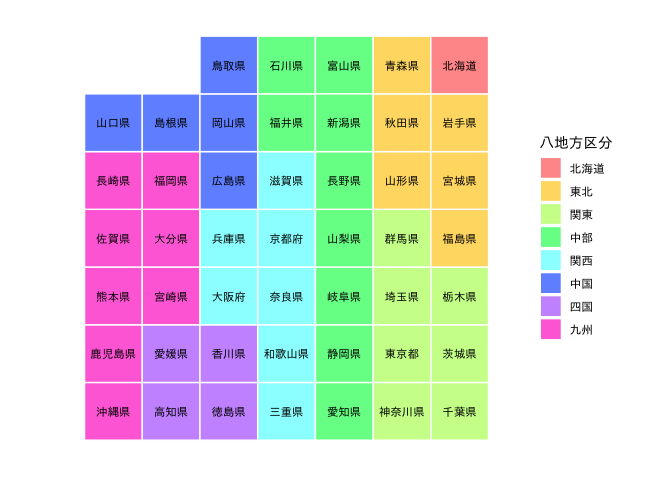
47都道府県
tabularmap(jpn77,
           x,
           y,
           group = prefecture,
           fill = region_kanji,
           label = prefecture_kanji,
           size = 3,
           family = "IPAexGothic") +
  theme_tabularmap(base_family = "IPAexGothic") +
  scale_fill_jpregion(lang = "jp",
                      name = "八地方区分")
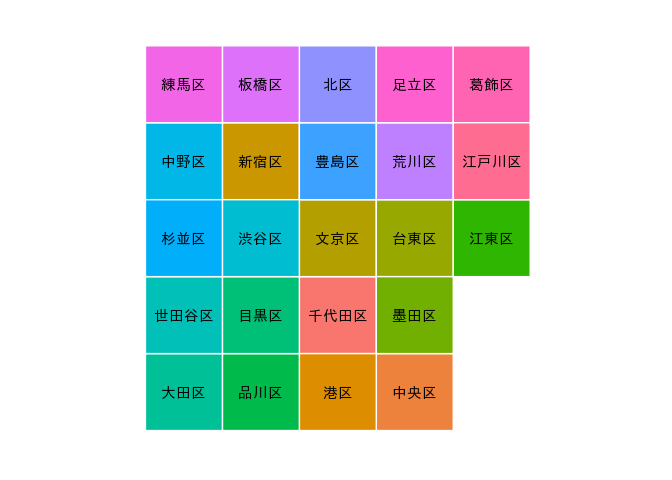
 東京23区
東京23区
tabularmap(tky23,
           x,
           y,
           group = ward,
           fill = ward,
           label = ward_kanji,
           family = "IPAexGothic",
           .expand_size = 12.5) +
  theme_tabularmap(base_family = "IPAexGothic") +
  guides(fill = FALSE)

国際
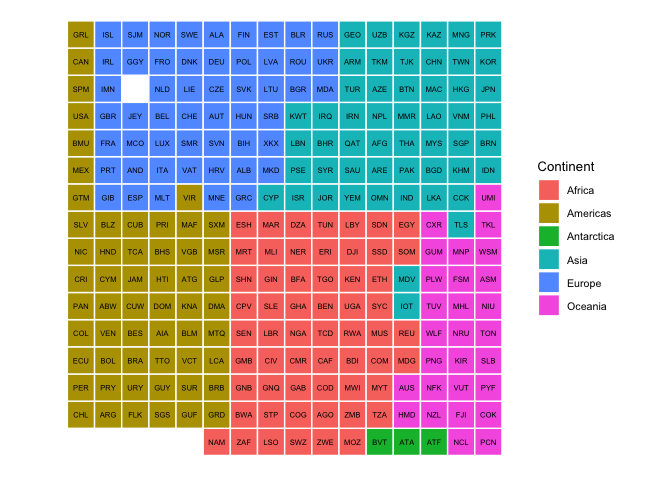
ISO-3166による国名
tabularmap(iso3166,
           x,
           y,
           group = iso3c,
           fill = continent,
           label = iso3c,
           size = 2,
           .expand_size = 20,
           .radius_size = 10) +
  theme_tabularmap() +
  guides(fill = guide_legend(title = "Continent")) +
  theme(legend.title = element_text(size = 10),
        legend.text = element_text(size = 8))

