MyNixOS website logo
Description

Spectroscopy Analysis Using the Tidy Data Philosophy.

Enables the analysis of spectroscopy data such as infrared ('IR'), Raman, and nuclear magnetic resonance ('NMR') using the tidy data framework from the 'tidyverse'. The 'tidyspec' package provides functions for data transformation, normalization, baseline correction, smoothing, derivatives, and both interactive and static visualization. It promotes structured, reproducible workflows for spectral data exploration and preprocessing. Implemented methods include Savitzky and Golay (1964) "Smoothing and Differentiation of Data by Simplified Least Squares Procedures" <doi:10.1021/ac60214a047>, Sternberg (1983) "Biomedical Image Processing" <https://ieeexplore.ieee.org/stamp/stamp.jsp?tp=&arnumber=1654163>, Zimmermann and Kohler (1996) "Baseline correction using the rolling ball algorithm" <doi:10.1016/0168-583X(95)00908-6>, Beattie and Esmonde-White (2021) "Exploration of Principal Component Analysis: Deriving Principal Component Analysis Visually Using Spectra" <doi:10.1177/0003702820987847>, Wickham et al. (2019) "Welcome to the tidyverse" <doi:10.21105/joss.01686>, and Kuhn, Wickham and Hvitfeldt (2024) "recipes: Preprocessing and Feature Engineering Steps for Modeling" <https://CRAN.R-project.org/package=recipes>.

tidyspec

R-CMD-check License:MIT

The goal of tidyspec is to provide a friendly pipeline for spectroscopy analysis using the tidy data philosophy.

Installation

You can install the development version of tidyspec from GitHub with:

# install.packages("devtools")
devtools::install_github("marceelrf/tidyspec")

About

The tidyspec package was design to enable the data analysis of spectroscopy data (as IR, Raman, NMR) with the tidy-data format. There are 6 families of functions in tidyspec, all starting with spec_:

  • Transformation: Convert data from absorbance to transmittance (spec_abs2trans) & from transmittance to absorbance (spec_trans2abs).

  • Normalize: Normalize the data to range 0-1 (spec_norm_01), normalize between a custom range (spec_norm_minmax), or normalize to have a standard deviation of one (spec_norm_var).

  • Baseline correction: Correct the baseline using the the rolling ball algorithm (spec_blc_rollingBall) or Iterative Restricted Least Squares (spec_blc_irls). The function spec_bl return the baseline vectors (spec_bl_rollingBall, spec_bl_irls).

  • Smooth correction: Smooth the data using the average window (spec_smooth_avg) or using the Savitzky-Golay algorithm (spec_smooth_sga).

  • Derivative: Create differential data from the spectra (spec_diff).

  • Preview: Preview your data while applying changes statically (spec_smartplot) or interactively (spec_smartplotly).

  • Import/Export: Import spectra data from common data formats, like csv, txt, tsv, xslx and xls, with spec_read. Export functions will be created in next moment, but user can easily use {readr} or {writexl} functions.

The function set_spec_wn simplifies the use of functions by globally defining the column that contains the wave numbers. User can check the wavenumber column with check_wn_col.

Example

This is a basic example which shows you how to solve a common problem:

library(tidyspec)

The data

head(CoHAspec)
#> # A tibble: 6 x 5
#>   Wavenumber CoHA01 CoHA025 CoHA05 CoHA100
#>        <dbl>  <dbl>   <dbl>  <dbl>   <dbl>
#> 1       399.  0.871    1.36  1.17    1.05 
#> 2       401.  0.893    1.24  1.05    0.925
#> 3       403.  0.910    1.20  0.997   0.876
#> 4       405.  0.914    1.19  0.982   0.867
#> 5       407.  0.908    1.18  0.965   0.857
#> 6       409.  0.887    1.14  0.936   0.828

Set the wavenumber column

set_spec_wn("Wavenumber")

check_wn_col()
#> The current wavenumber column is: Wavenumber
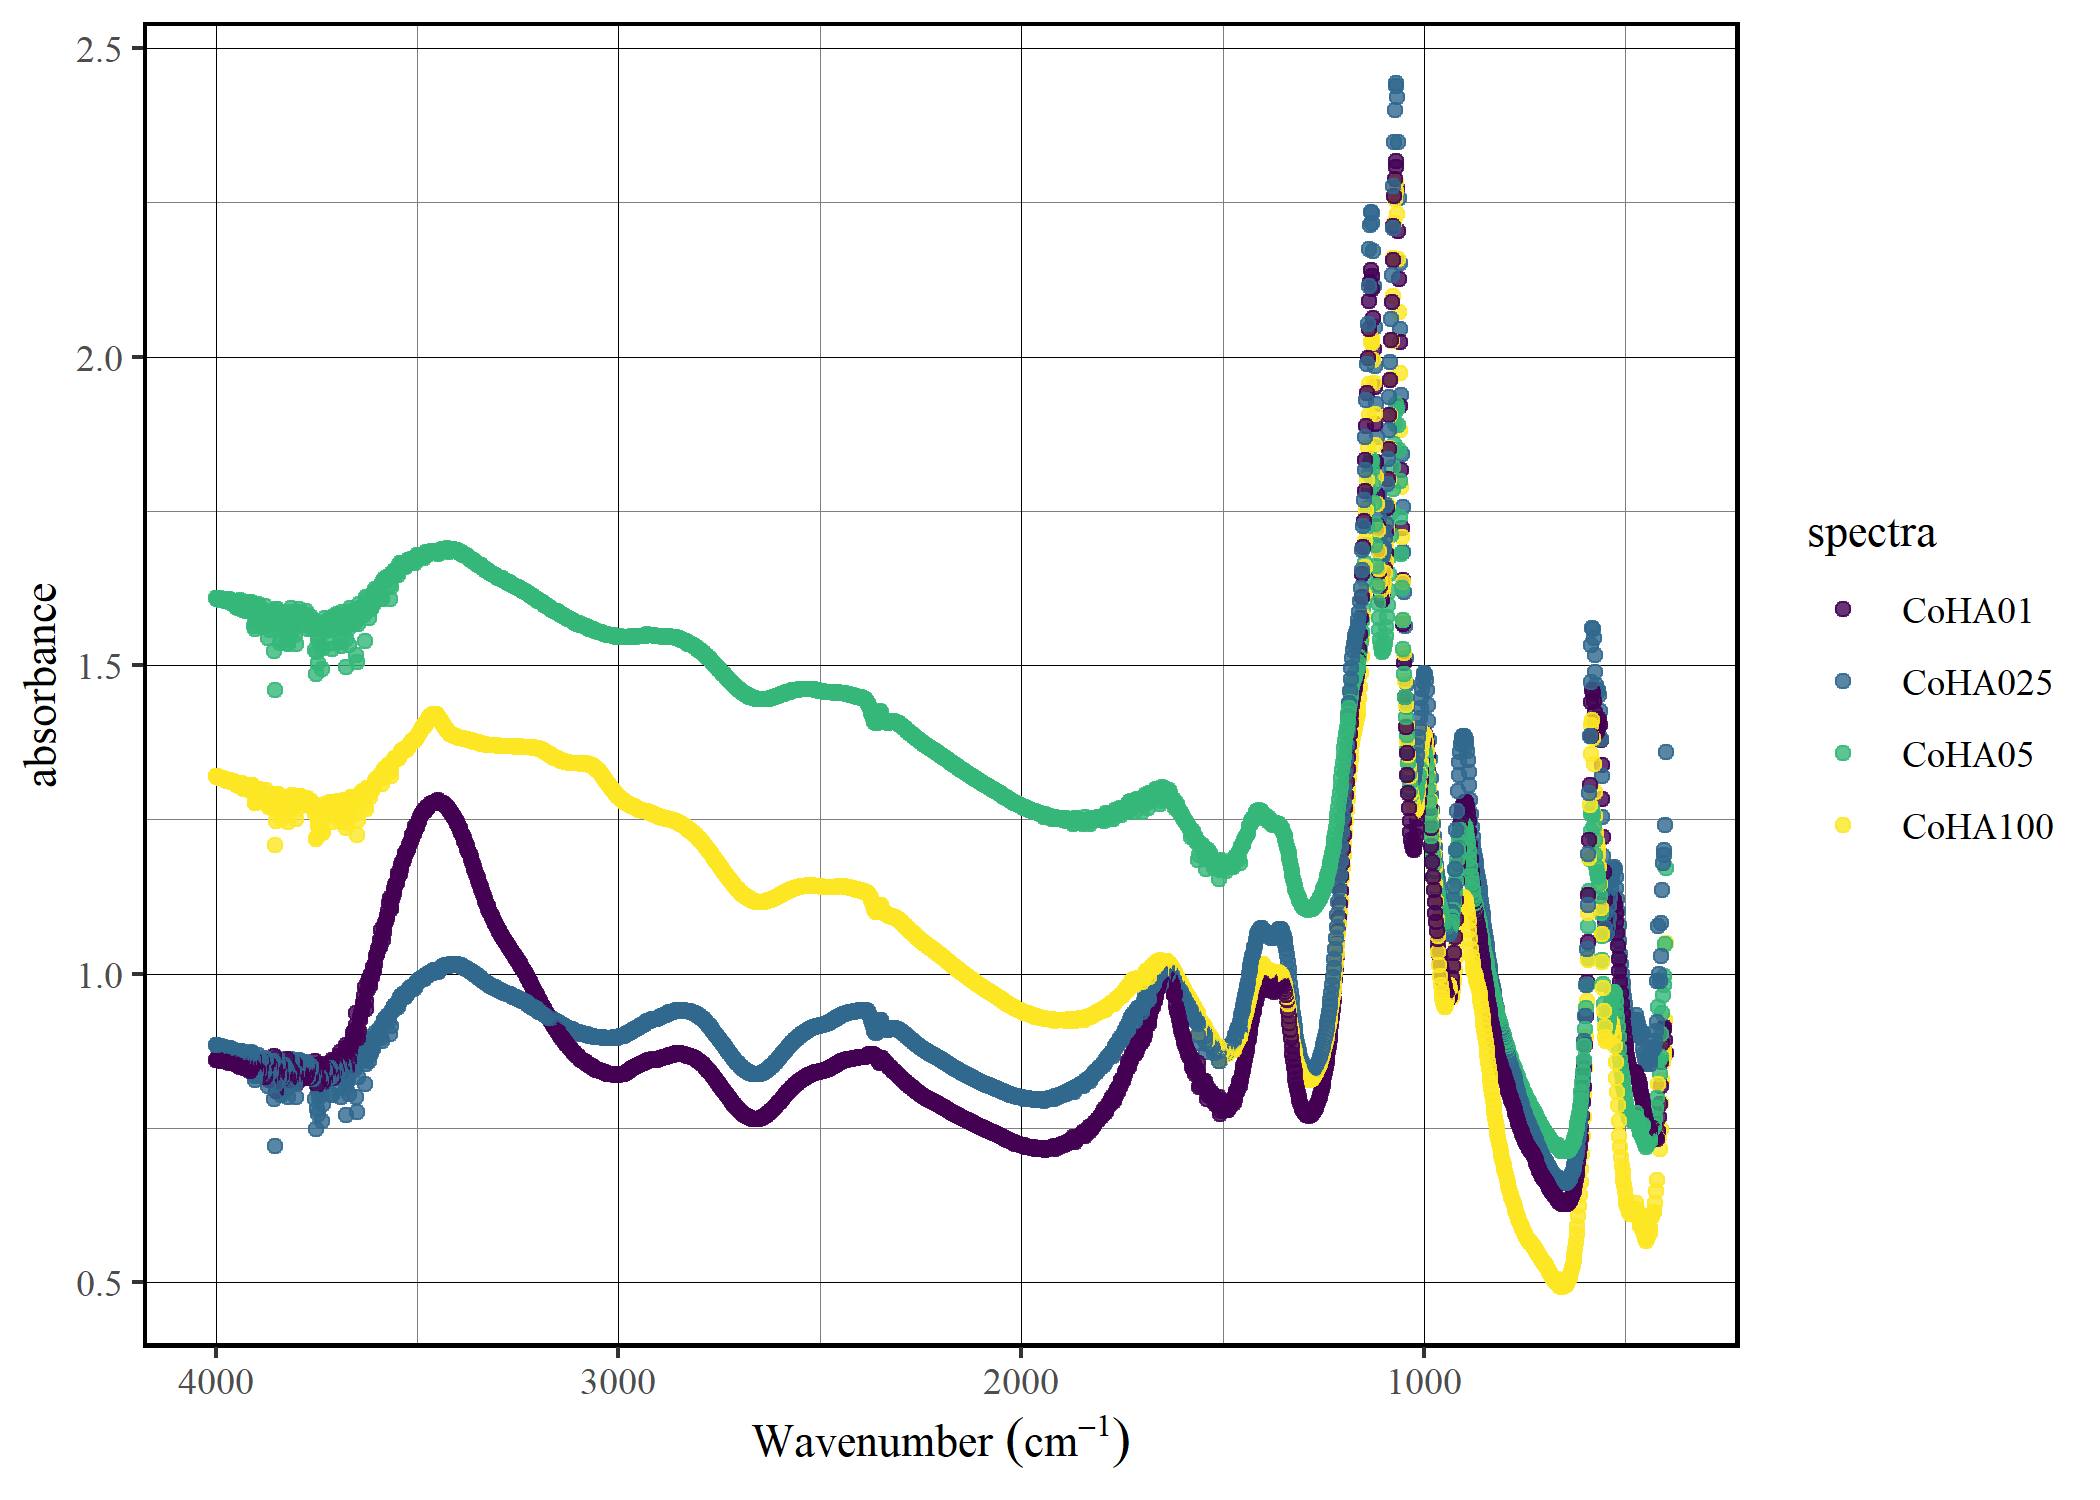
Plot the data

spec_smartplot(CoHAspec)
Static plot

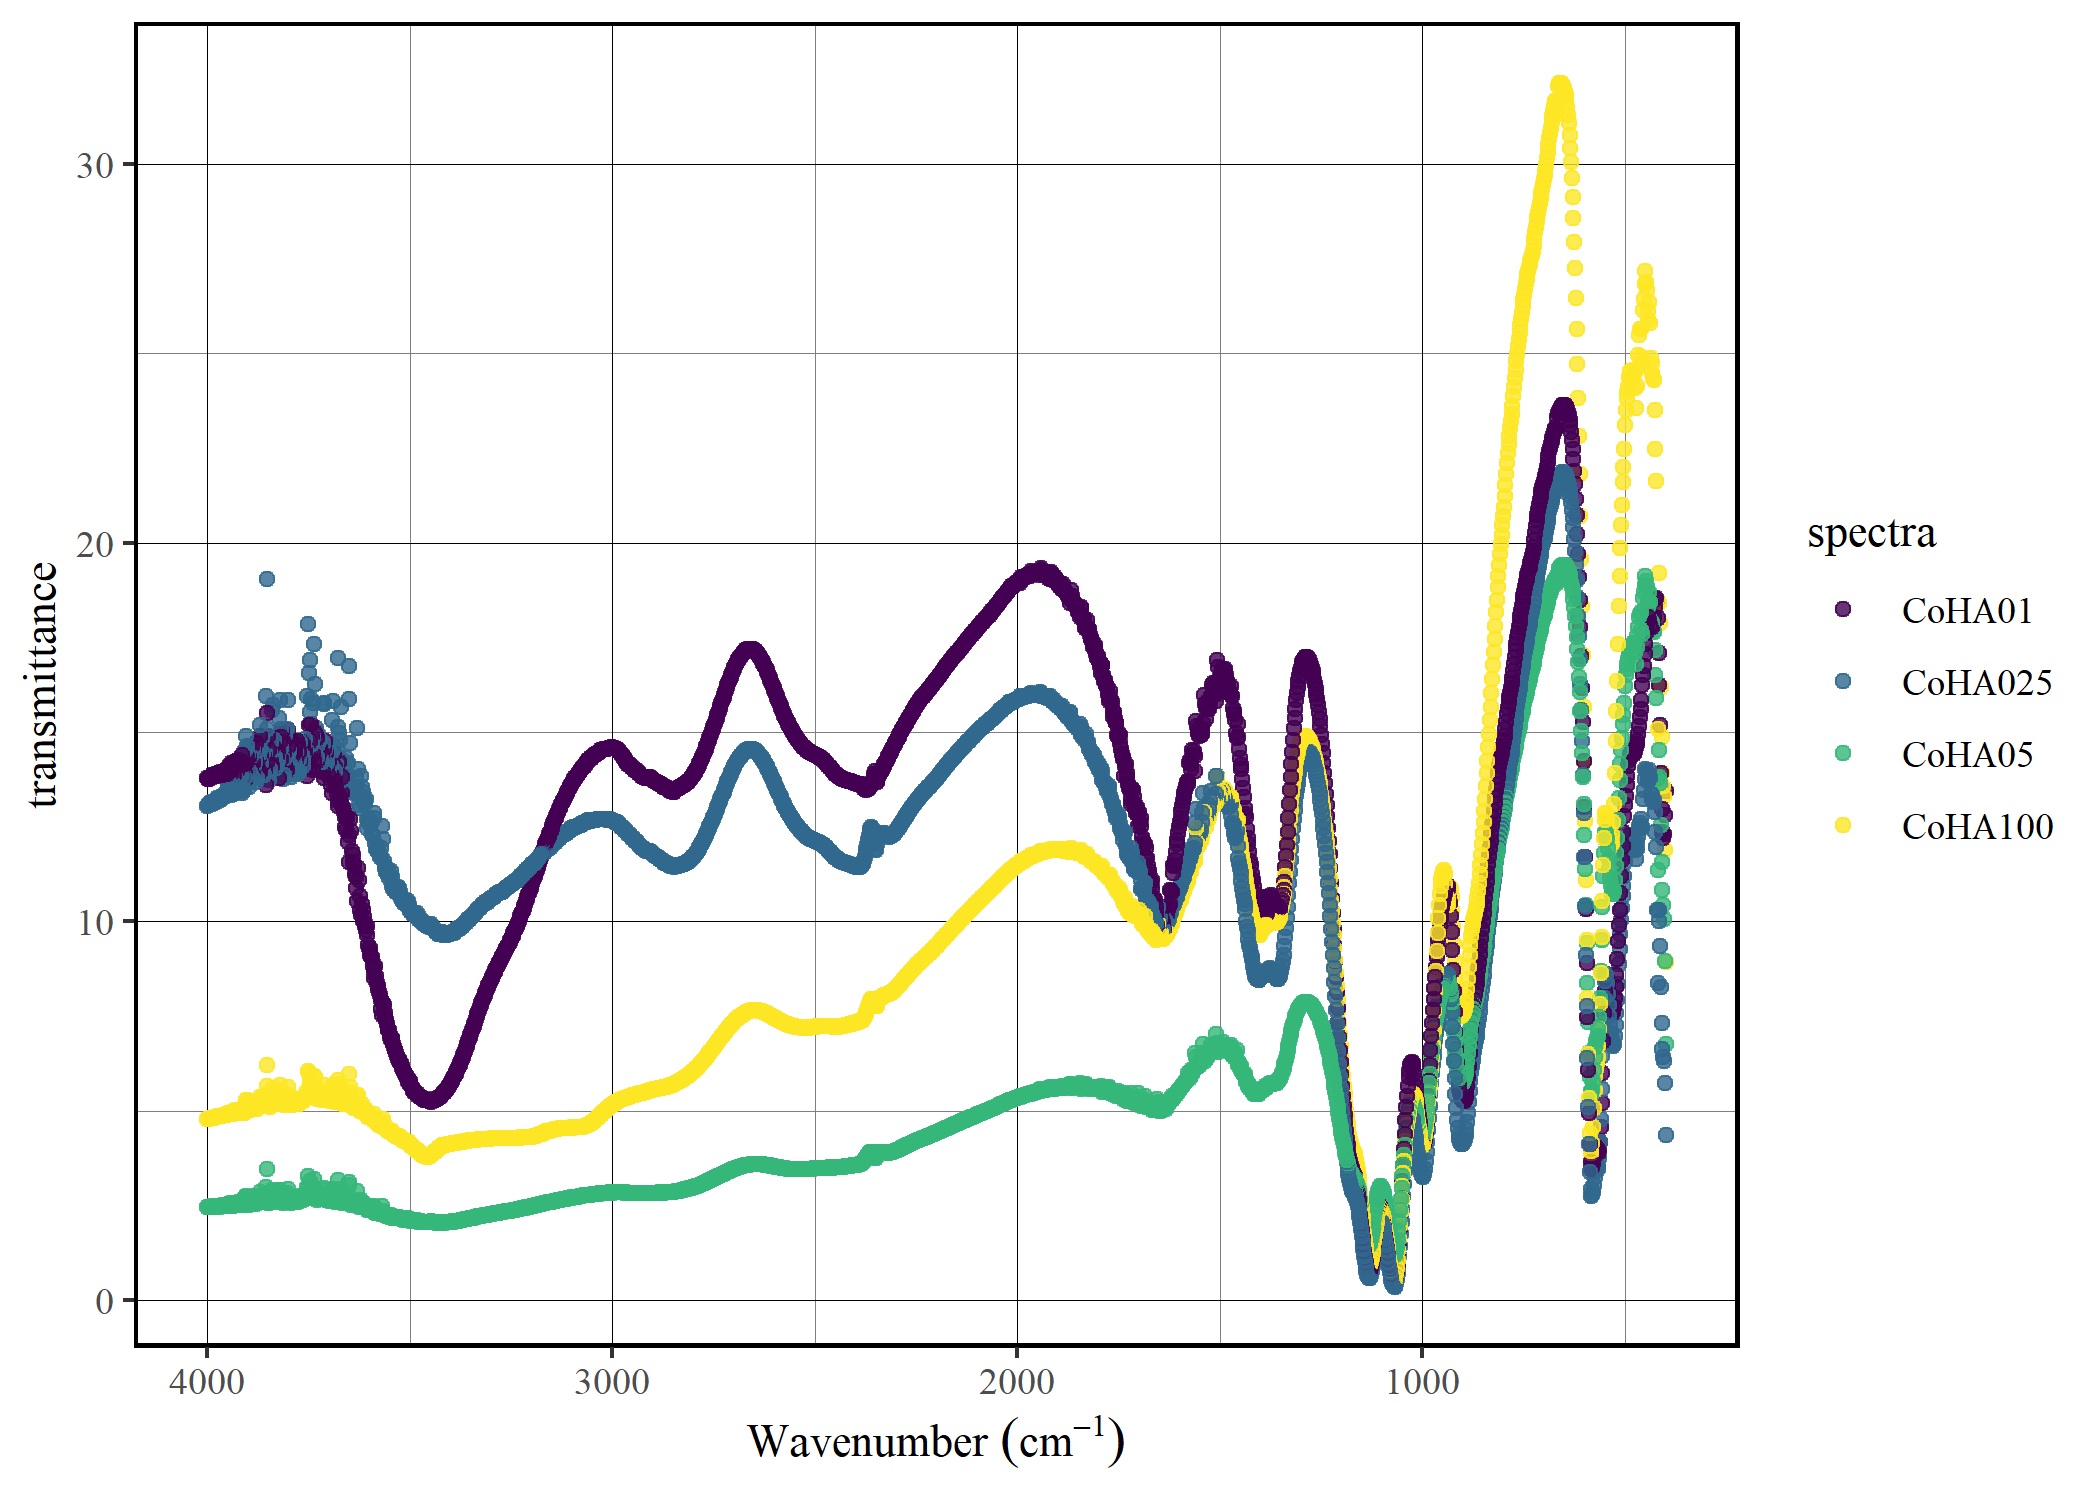
Convert to trasmittance

CoHAspec |>
    spec_abs2trans() |>
    spec_smartplot(type = "transmittance")
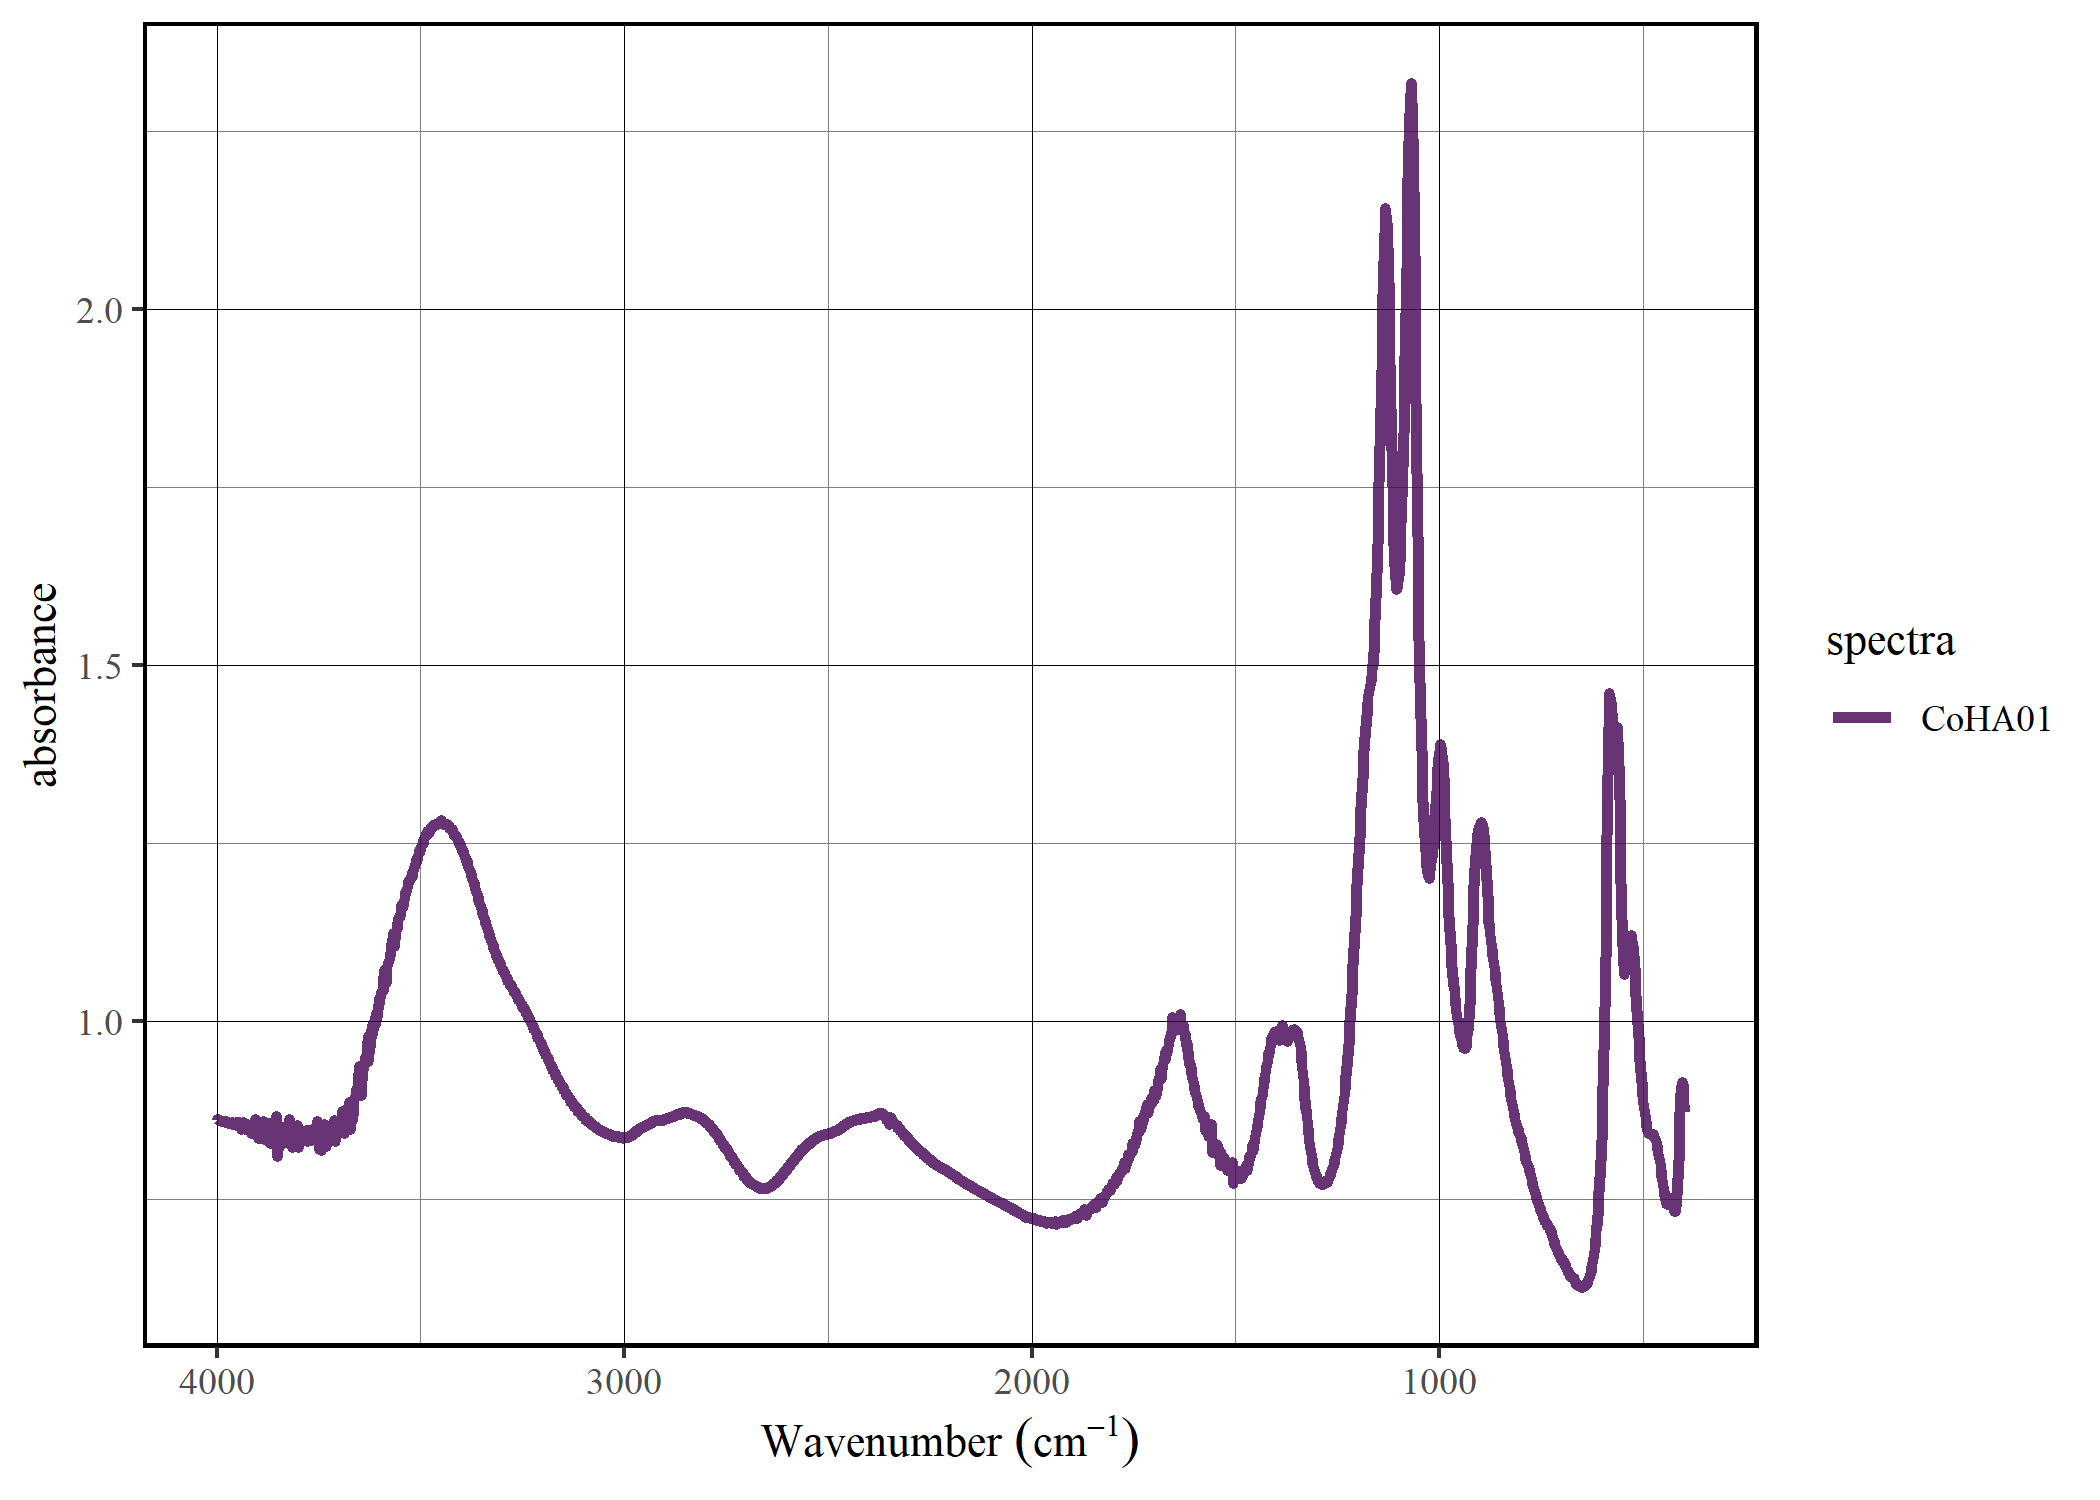
Transmittance plot

Select the spectra

spec_select(CoHAspec, CoHA01) |>
  spec_smartplot(geom = "line")
CoHA01 plot

The future of tidyspec

Our plan is for tidyspec to be the first step toward a complete ecosystem for spectral data analysis. For spectral band analysis, we are creating the bandspec package that handles different band profiles. We also intend to create a package focused on producing publication-level graphics for spectral data. We haven’t thought of a name yet, so we welcome suggestions!

Metadata

Version

0.1.0

License

Unknown

Platforms (75)

    Darwin
    FreeBSD
    Genode
    GHCJS
    Linux
    MMIXware
    NetBSD
    none
    OpenBSD
    Redox
    Solaris
    WASI
    Windows
Show all
  • aarch64-darwin
  • aarch64-freebsd
  • aarch64-genode
  • aarch64-linux
  • aarch64-netbsd
  • aarch64-none
  • aarch64-windows
  • aarch64_be-none
  • arm-none
  • armv5tel-linux
  • armv6l-linux
  • armv6l-netbsd
  • armv6l-none
  • armv7a-linux
  • armv7a-netbsd
  • armv7l-linux
  • armv7l-netbsd
  • avr-none
  • i686-cygwin
  • i686-freebsd
  • i686-genode
  • i686-linux
  • i686-netbsd
  • i686-none
  • i686-openbsd
  • i686-windows
  • javascript-ghcjs
  • loongarch64-linux
  • m68k-linux
  • m68k-netbsd
  • m68k-none
  • microblaze-linux
  • microblaze-none
  • microblazeel-linux
  • microblazeel-none
  • mips-linux
  • mips-none
  • mips64-linux
  • mips64-none
  • mips64el-linux
  • mipsel-linux
  • mipsel-netbsd
  • mmix-mmixware
  • msp430-none
  • or1k-none
  • powerpc-netbsd
  • powerpc-none
  • powerpc64-linux
  • powerpc64le-linux
  • powerpcle-none
  • riscv32-linux
  • riscv32-netbsd
  • riscv32-none
  • riscv64-linux
  • riscv64-netbsd
  • riscv64-none
  • rx-none
  • s390-linux
  • s390-none
  • s390x-linux
  • s390x-none
  • vc4-none
  • wasm32-wasi
  • wasm64-wasi
  • x86_64-cygwin
  • x86_64-darwin
  • x86_64-freebsd
  • x86_64-genode
  • x86_64-linux
  • x86_64-netbsd
  • x86_64-none
  • x86_64-openbsd
  • x86_64-redox
  • x86_64-solaris
  • x86_64-windows