Vincent van Gogh Colour Palette Generator.
vangogh 
![]()
![]()
An R package for painterly colour palettes inspired by Vincent van Gogh's artworks. The vangogh package provides ggplot2-compatible colour palettes derived from the artist's most iconic paintings, with tools for accessibility, visualisation, and data export.
Installation
Install the released version from CRAN:
install.packages("vangogh")
Quick Start
Basic Palette Usage
library(vangogh)

# View available palettes
names(vangogh_palettes)

# Preview a palette
viz_palette("StarryNight")

# Get colours from a palette
vangogh_palette("StarryNight")

# Get palette as data frame
vangogh_colors()

# Use specific number of colours
vangogh_palette("Irises", n = 3)

# Generate continuous palette
vangogh_palette("SelfPortrait", type = "continuous", n = 10)

# Use with base R plotting
plot(1:10, col = vangogh_palette("SelfPortrait"), pch = 19, cex = 2)

# Use with ggplot2
library(ggplot2)
ggplot(iris, aes(Sepal.Length, Sepal.Width, color = Species)) +
  geom_point(size = 4) +
  scale_color_vangogh("StarryNight")
Available Palettes
| StarryNight | StarryRhone | SelfPortrait | CafeTerrace | Eglise |
|---|---|---|---|---|
| Irises | SunflowersMunich | SunflowersLondon | Rest | Bedroom |
|---|---|---|---|---|
| CafeDeNuit | Chaise | Shoes | Landscape | Cypresses |
|---|---|---|---|---|
Essential Functions
ggplot2 Integration
# Colour scale for categorical data
ggplot(iris, aes(x = Sepal.Length, y = Sepal.Width, color = Species)) +
  geom_point(size = 3) +
  scale_color_vangogh("StarryNight")

# Fill scale for categorical data
ggplot(mpg, aes(x = class, fill = drv)) +
  geom_bar(position = "dodge") +
  scale_fill_vangogh("CafeTerrace")

# Continuous fill scale
ggplot(faithfuld, aes(waiting, eruptions, fill = density)) +
  geom_tile() +
  scale_fill_vangogh("Irises", type = "continuous")
Van Gogh Themes
Apply artistic themes to your plots:
# Available theme variants: "classic", "light", "dark", "sketch"
ggplot(iris, aes(Sepal.Length, Sepal.Width, color = Species)) +
  geom_point(size = 4) +
  scale_color_vangogh("Irises") +
  theme_vangogh("classic")

ggplot(mtcars, aes(wt, mpg)) +
  geom_point(size = 3, color = "#F4A460") +
  theme_vangogh("sketch")
Feature Gallery
A few example plots using Van Gogh palettes.
StarryNight - geombar() Example
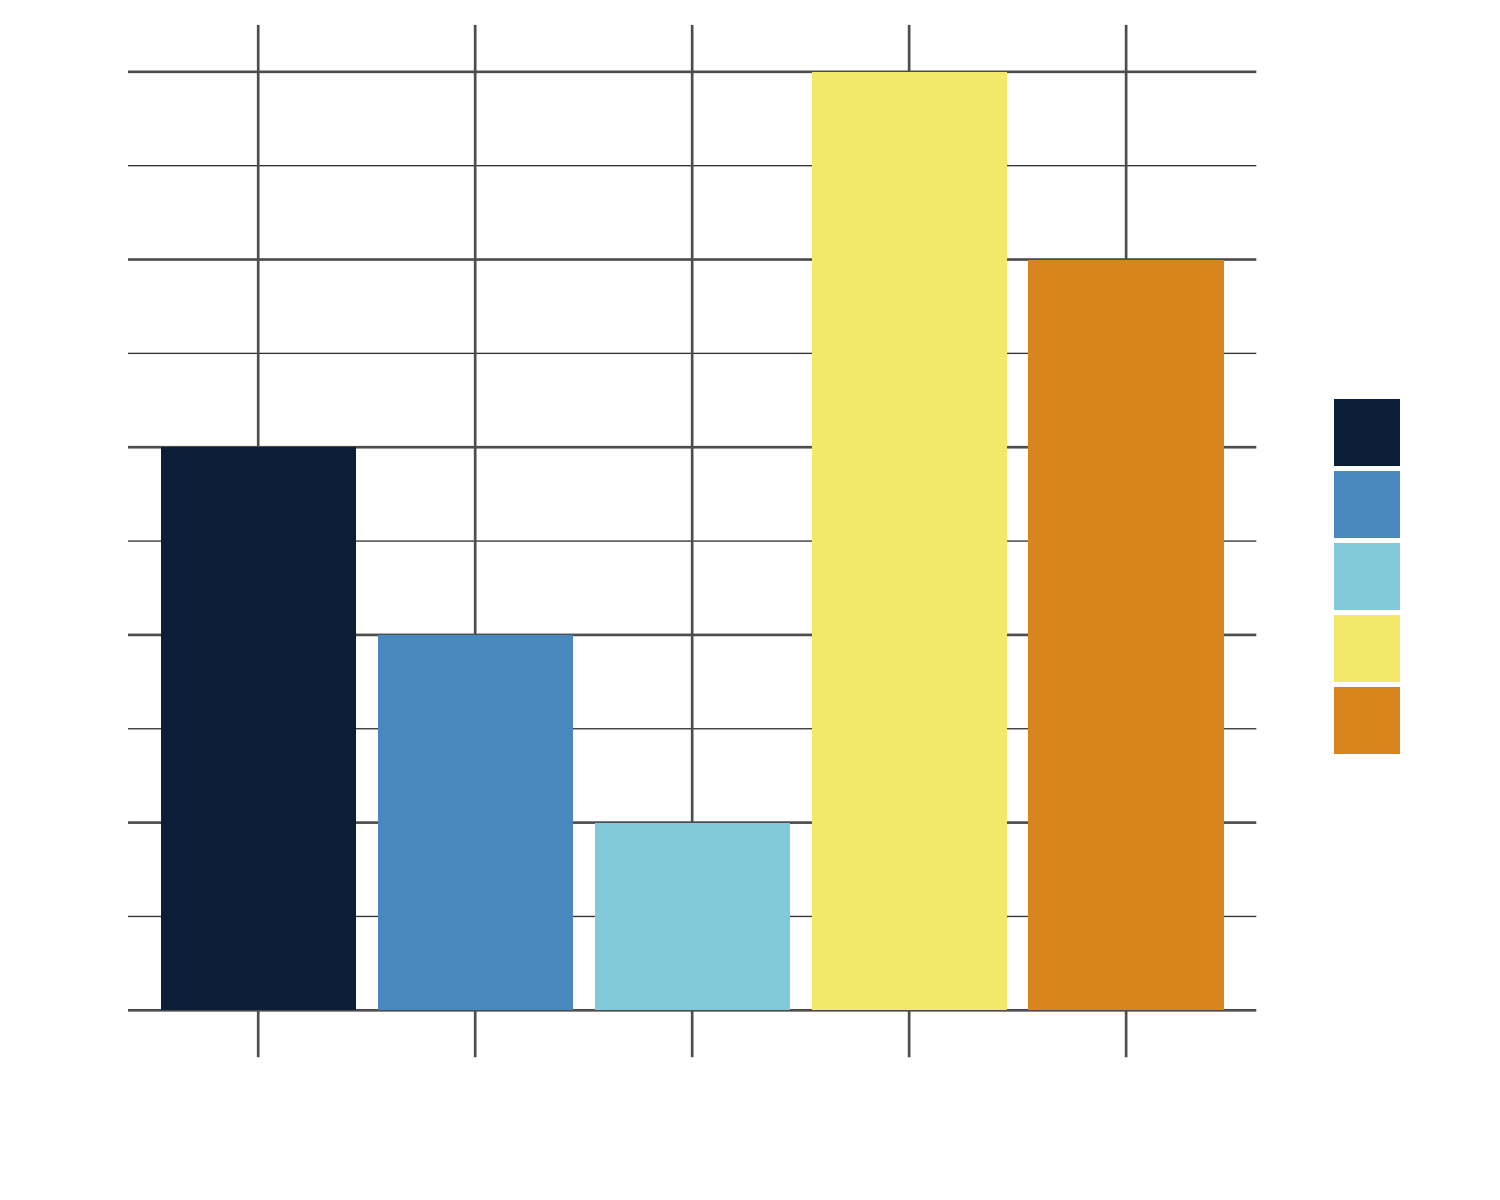
df1 <- data.frame(x = letters[1:5], y = sample(1:5))
ggplot(df1, aes(x, y, fill = x)) +
  geom_bar(stat = "identity") +
  scale_fill_vangogh("StarryNight") +
  theme_minimal()
SunflowersMunich - geom_point() Example
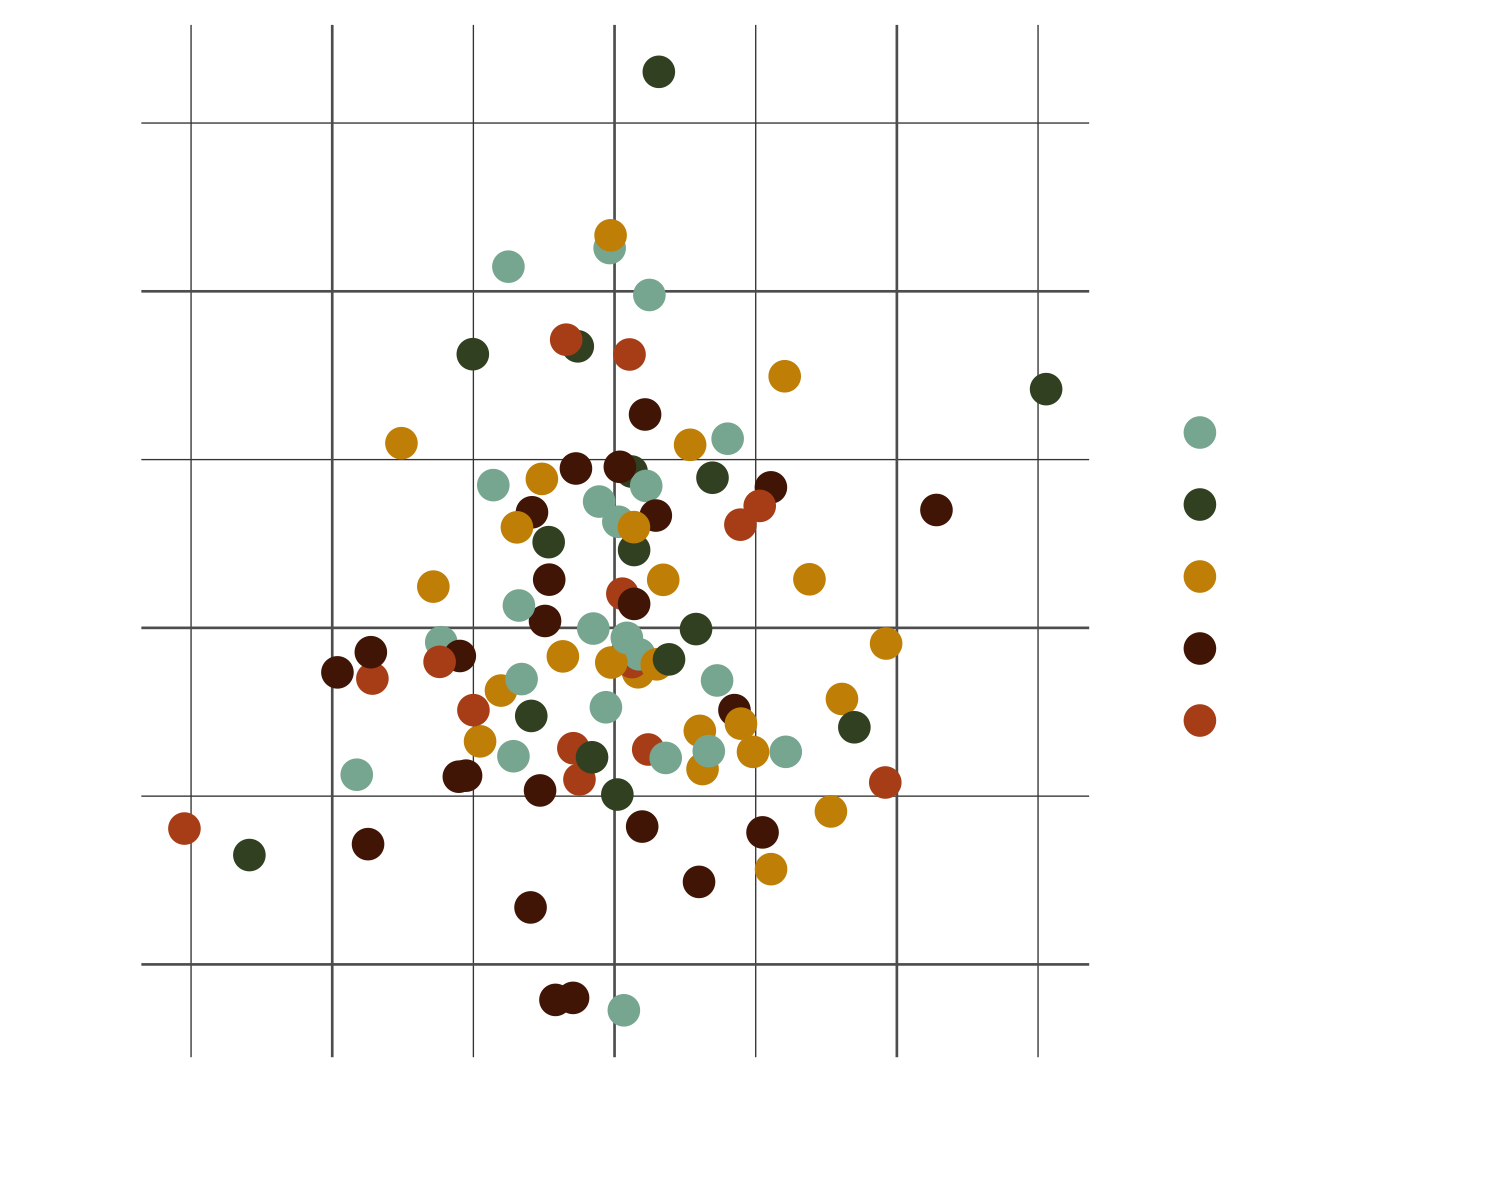
df2 <- data.frame(
  x = rnorm(100),
  y = rnorm(100),
  group = sample(1:5, 100, replace = TRUE))
ggplot(df2, aes(x, y, color = factor(group))) +
  geom_point(size = 3) +
  scale_color_vangogh("SunflowersMunich") +
  theme_minimal()
SelfPortrait - geom_line() Example
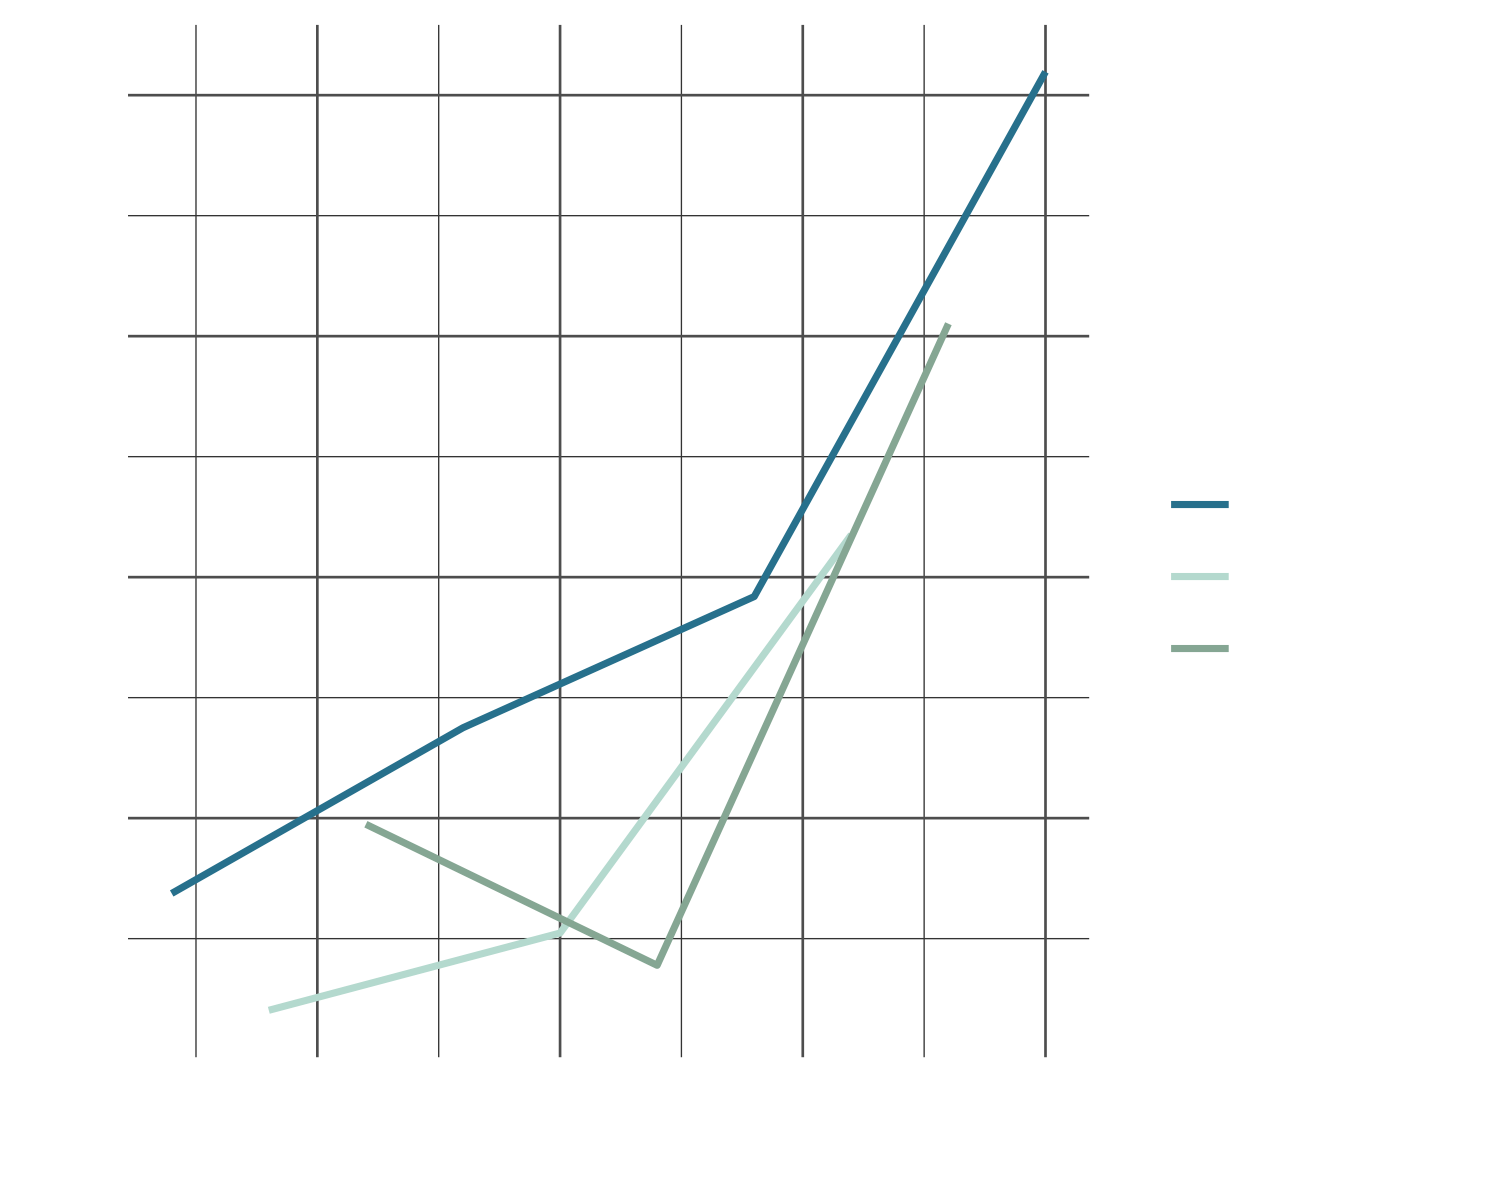
df3 <- data.frame(
  x = 1:10,
  y = cumsum(rnorm(10)),
  group = rep(1:3, length.out = 10))
ggplot(df3, aes(x, y, color = factor(group))) +
  geom_line(linewidth = 1.2) +
  scale_color_vangogh("SelfPortrait") +
  theme_minimal()
Advanced Features
Palette Analysis and Accessibility
Analyse palettes with optional colour space metadata:
# Basic palette information
vangogh_palette_info()

# With HCL colour space data
vangogh_palette_info(add_metadata = TRUE)

# Check accessibility across colour vision types
check_palette("StarryNight")
Palette Comparison and Selection
# Compare multiple palettes side-by-side
compare_palettes(c("StarryNight", "SelfPortrait", "Irises"))

# Get palette suggestions based on number of colours needed
vangogh_suggest(n = 3)

# Get all palette data as a tidy data frame
all_colors <- vangogh_colors(add_metadata = TRUE)
Data Export
Export palettes for use in other applications:
# Export to JSON
vangogh_export("my_palettes.json", format = "json", add_metadata = TRUE)

# Export to CSV
vangogh_export("my_palettes.csv", format = "csv")
Function Reference
| Function | Description |
|---|---|
vangogh_palette() | Extract colours from a Van Gogh palette |
vangogh_palettes | List of all available palettes |
scale_color_vangogh() | ggplot2 colour scale |
scale_fill_vangogh() | ggplot2 fill scale |
theme_vangogh() | Van Gogh-inspired ggplot2 themes |
viz_palette() | Visualise a palette |
check_palette() | Comprehensive accessibility check |
compare_palettes() | Side-by-side palette comparison |
vangogh_suggest() | Get palette recommendations |
vangogh_colors() | Export all palettes as tidy data |
vangogh_export() | Export palettes to JSON or CSV |
Package Philosophy
Van Gogh's use of colour was revolutionary, employing vivid hues and bold contrasts to convey emotion and movement. This package aims to bring that same artistic sensibility to data visualisation, while maintaining the technical rigor required for clear, accessible communication of information.
Each palette contains five carefully selected colours derived from the original paintings, balancing aesthetic appeal with practical considerations for data visualisation.
License
MIT License. See LICENSE file for details.
Contributing
Want to contribute? Great! You can:
- Report bugs or suggest features via GitHub Issues
- Submit pull requests for improvements
- Add new Van Gogh palettes with proper documentation.