Description
Visualize Draws from the Prior and Posterior Distributions.
Description
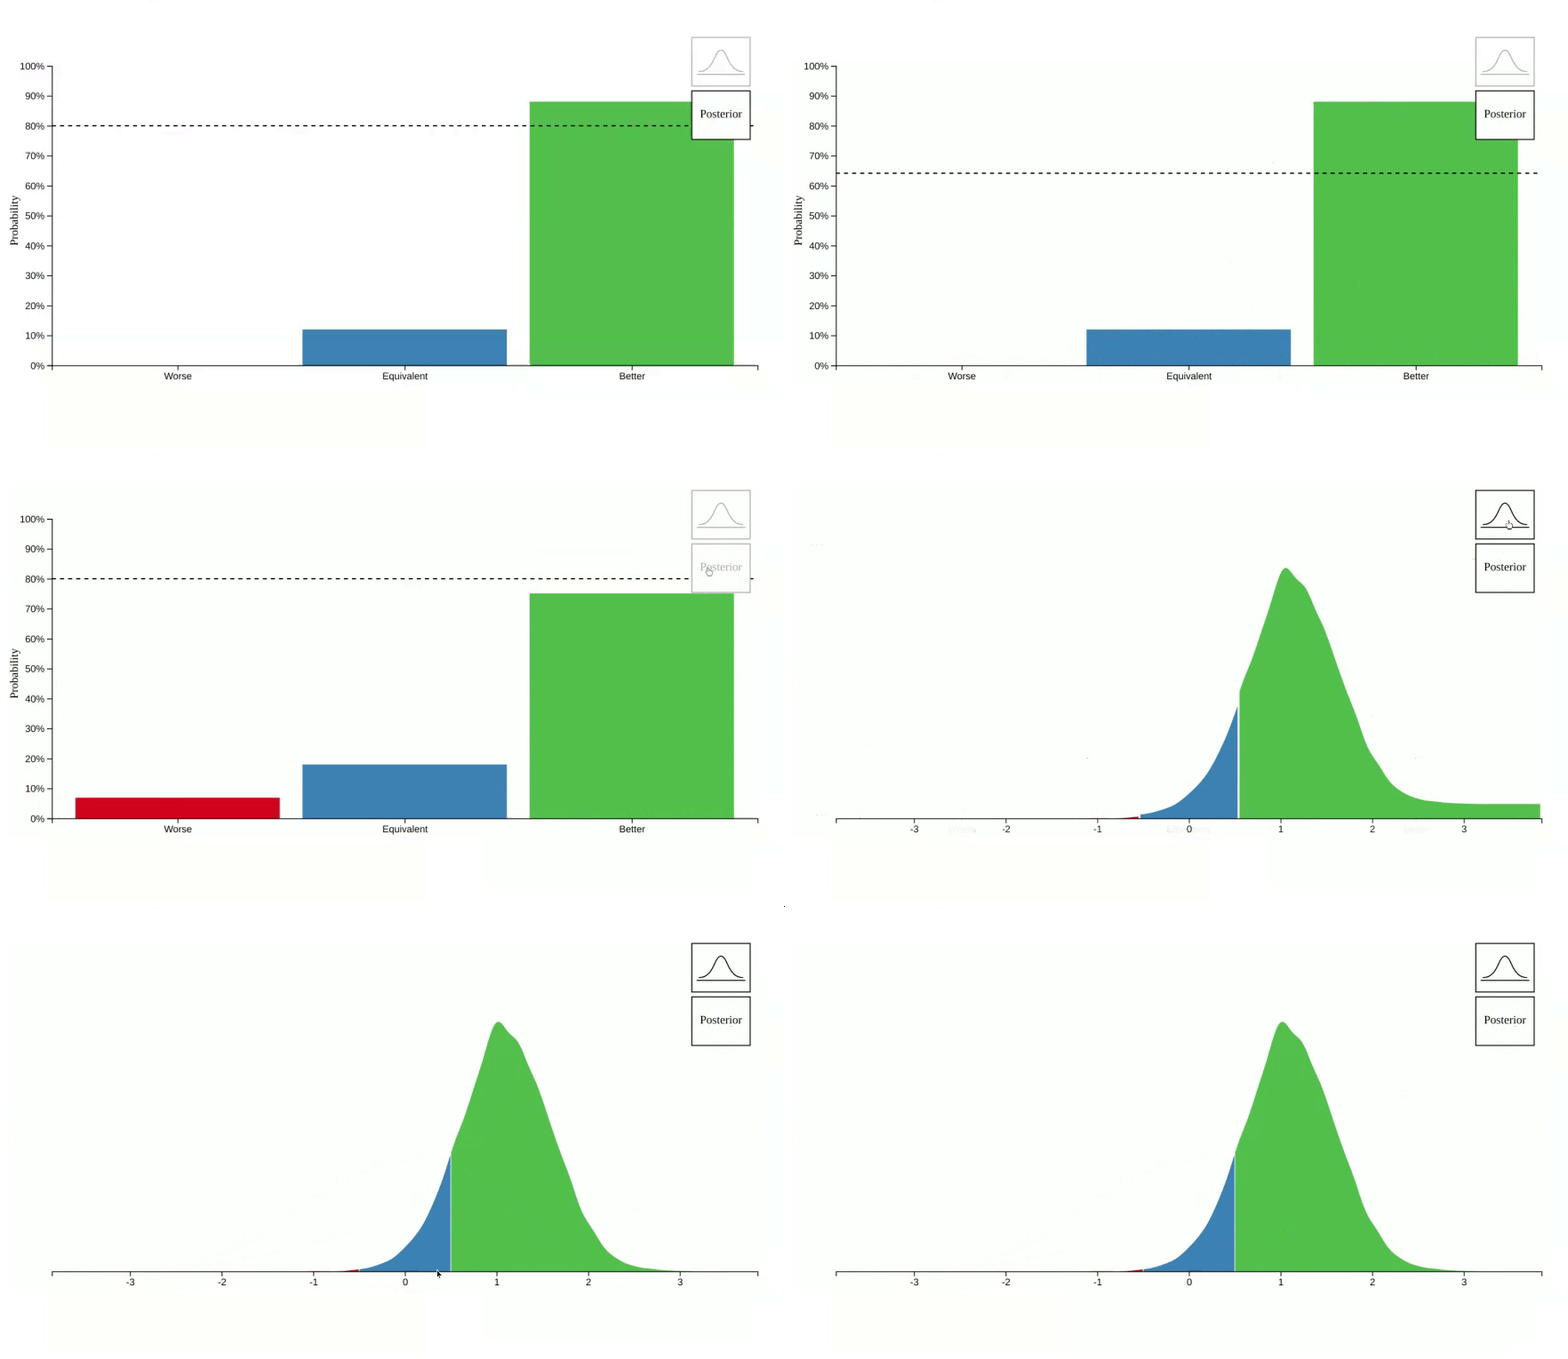
Interactive visualization for Bayesian prior and posterior distributions. This package facilitates an animated transition between prior and posterior distributions. Additionally, it splits the distribution into bars based on the provided 'breaks,' displaying the probability for each region. If no 'breaks' are provided, it defaults to zero.
README.md
vizdraws
vizdraws creates interactive visualizations using draws from a prior and posterior distributions.
Installation
install.packages('vizdraws')
The latest development version can be installed from github:
# install.packages("remotes")
remotes::install_github('ignacio82/vizdraws')
Example
This is a example which shows you how to how to visualize the transition from the prior to the posterior:
library(vizdraws)
set.seed(9782)
vizdraws(prior = rnorm(10000, 0, 1), posterior = rnorm(10000, 1.1, 0.5), MME = 0.5, threshold = 0.8)

Notes
The bell-curve icon was created by Davo Sime.