MyNixOS website logo
Description

Incrementally Build Complex Plots using Natural Semantics.

Builds complex plots, heatmaps in particular, using natural semantics. Bigger plots can be assembled using directives such as 'LeftOf', 'RightOf', 'TopOf', and 'Beneath' and more. Other features include clustering, dendrograms and integration with 'ggplot2' generated grid objects. This package is particularly designed for bioinformaticians to assemble complex plots for publication.

WHeatmap Travis-CI Build Status

WHeatmap designs a set of languages and a layer system that allows arbitrary positioning of heatmaps programmatically.

It makes plotting complex heatmaps using plain English such as TopOf, RightOf and BottomLeftOf etc.

To install from github using devtools,

library(devtools)
install_github('zwdzwd/wheatmap')

library(wheatmap)

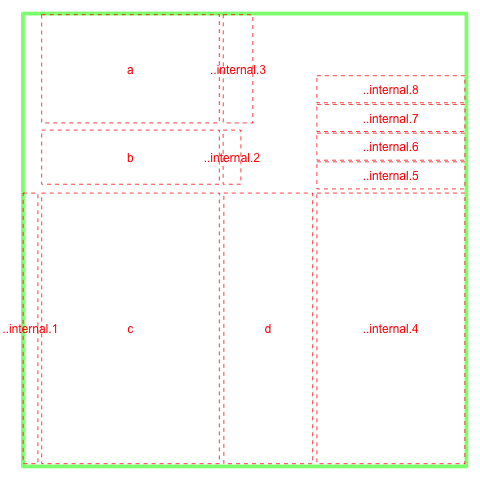
For example, the following complex layout

This complex layout

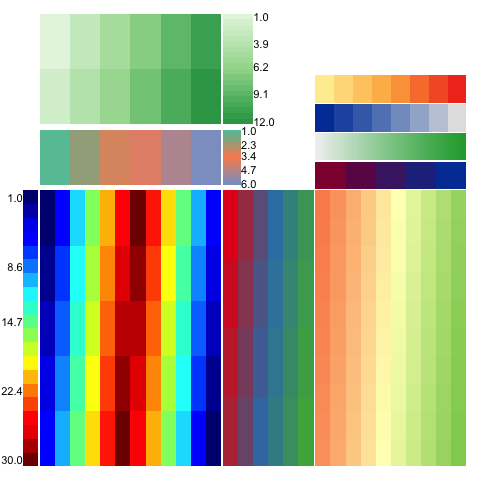
can be generated simply by

WHeatmap(matrix(1:12,nrow=2), cmp=CMPar(brewer.name='Greens'), name='a') + 
  WHeatmap(matrix(1:6,nrow=1), Beneath(pad=0.05), cmp=CMPar(brewer.name='Set2'), name='b') +
  WHeatmap(matrix(c(1:30,30:1),nrow=5), Beneath(pad=0.05), 'c', cmp=CMPar(cmap='jet')) +
  WHeatmap(matrix(1:24,nrow=4), RightOf('c'), 'd', cmp=CMPar(brewer.name='Set1')) +
  WLegendV('c', LeftOf('c', pad=0.01), yticklabel.side='l') +
  WLegendV('b', RightOf('b', width=0.1)) + 
  WLegendV('a', RightOf('a')) + 
  WHeatmap(matrix(1:100, nrow=10), RightOf('d'), cmp=CMPar(brewer.name='RdYlGn')) +
  WColorBarH(matrix(5:1), TopOf(), cmp=CMPar(colorspace.name = 'diverge_hcl')) +
  WColorBarH(matrix(50:1), TopOf(), cmp=CMPar(colorspace.name = 'terrain_hcl')) +
  WColorBarH(matrix(1:8), TopOf(), cmp=CMPar(colorspace.name = 'sequential_hcl')) +
  WColorBarH(matrix(1:8), TopOf(), cmp=CMPar(brewer.name = 'YlOrRd'))

One who is really obssessed with %>% can do something like

library(magrittr)
WHeatmap(cc$mat, name='h1') %>% add(WColorBarV(row.data, LeftOf('h1'), 'c1'))

The layout looks like

this

In order to cross-refer panels in the plot, one has to use a unique name. This name can be given through the name= option and user has to make sure the uniqueness of the names from existing objects in the plot. If not specified, wheatmap can generate a unique name and that name is visible from ly() function. A special NULL tag can be used to refer to the last plotted object.

More User guides:

Acknowledgement

  • The internal grid.dendrogram() function is adapted from ComplexHeatmap package.
Metadata

Version

0.2.0

License

Unknown

Platforms (75)

    Darwin
    FreeBSD 13
    Genode
    GHCJS
    Linux
    MMIXware
    NetBSD
    none
    OpenBSD
    Redox
    Solaris
    WASI
    Windows
Show all
  • aarch64-darwin
  • aarch64-genode
  • aarch64-linux
  • aarch64-netbsd
  • aarch64-none
  • aarch64_be-none
  • arm-none
  • armv5tel-linux
  • armv6l-linux
  • armv6l-netbsd
  • armv6l-none
  • armv7a-darwin
  • armv7a-linux
  • armv7a-netbsd
  • armv7l-linux
  • armv7l-netbsd
  • avr-none
  • i686-cygwin
  • i686-darwin
  • i686-freebsd13
  • i686-genode
  • i686-linux
  • i686-netbsd
  • i686-none
  • i686-openbsd
  • i686-windows
  • javascript-ghcjs
  • loongarch64-linux
  • m68k-linux
  • m68k-netbsd
  • m68k-none
  • microblaze-linux
  • microblaze-none
  • microblazeel-linux
  • microblazeel-none
  • mips-linux
  • mips-none
  • mips64-linux
  • mips64-none
  • mips64el-linux
  • mipsel-linux
  • mipsel-netbsd
  • mmix-mmixware
  • msp430-none
  • or1k-none
  • powerpc-netbsd
  • powerpc-none
  • powerpc64-linux
  • powerpc64le-linux
  • powerpcle-none
  • riscv32-linux
  • riscv32-netbsd
  • riscv32-none
  • riscv64-linux
  • riscv64-netbsd
  • riscv64-none
  • rx-none
  • s390-linux
  • s390-none
  • s390x-linux
  • s390x-none
  • vc4-none
  • wasm32-wasi
  • wasm64-wasi
  • x86_64-cygwin
  • x86_64-darwin
  • x86_64-freebsd13
  • x86_64-genode
  • x86_64-linux
  • x86_64-netbsd
  • x86_64-none
  • x86_64-openbsd
  • x86_64-redox
  • x86_64-solaris
  • x86_64-windows